| Inhibition of Induced Chemoresistance by Cotreatment with BVDU |

|

|

|
Page 6 of 12
Results
In Vitro Experiments.
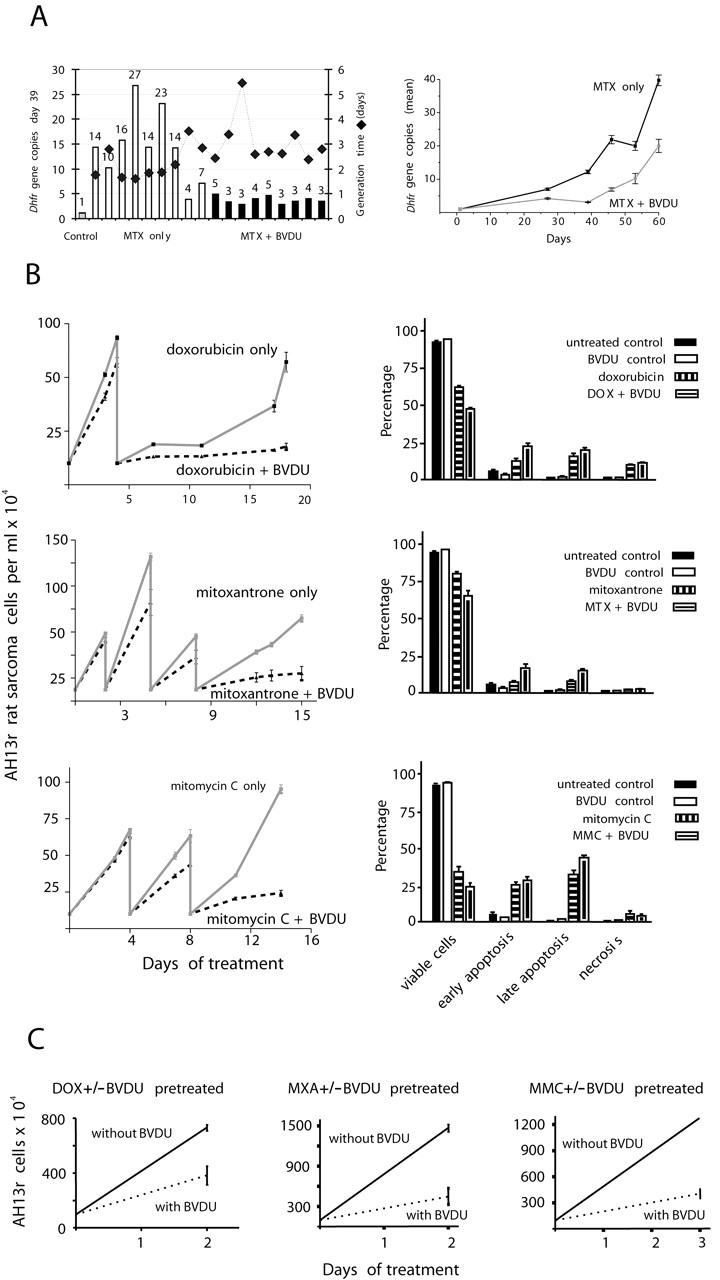
Fig. 1. In vitro experiments. A, Dhfr gene amplification in mouse 3T6 cells (nine independent sublines each). B, effect of BVDU on cell numbers and apoptosis in AH13r rat sarcoma cells. Left, treatment with cytostatic drugs only, or in combination with BVDU (three independent experiments). DOX, 1.33 ng/ml; MXA, day 0: 0.1 ng/ml, day 2: 0.1 ng/ml, day 5: 0.1 ng/ml, day 8: 0.15 ng/ml; MMC, day 0: 35 ng/ml, day 4: 50 ng/ml, day 8: 75 ng/ml; 10 µg/ml BVDU. Right, HOPI stain evaluation (mean value ± SD, nine independent experiments). C, effect of BVDU on the recovery of AH13r cells (three independent experiments).
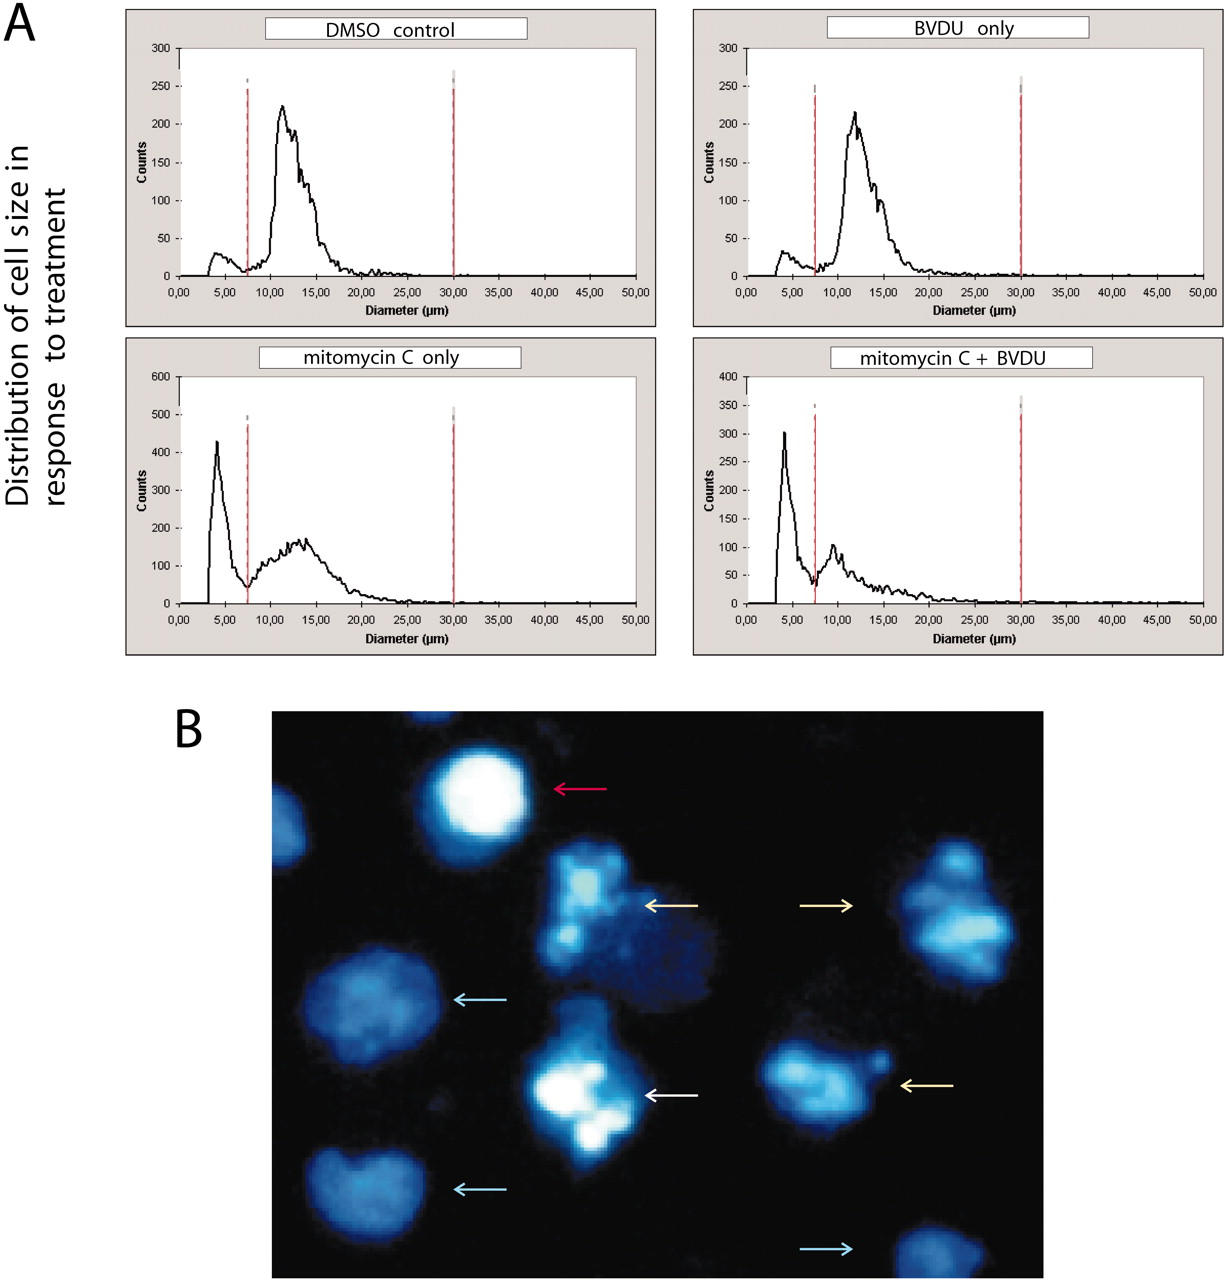
Furthermore, BVDU cotreatment sensitized AH13r sarcoma cells for chemotherapy-induced apoptosis (Fig. 1B). BVDU cotreatment significantly reduced cell numbers. BVDU itself was nontoxic (data not shown). We detected increasing numbers of pyknotic cells (7.5–11.5 µm diameter) as a result of BVDU combinatorial treatment (Fig. 2A) . This observation indicated an induction of apoptosis.
Fig. 2. Assessment of apoptosis. A, treatment of AH13r rat sarcoma cells. Cell size distribution profiles obtained on day 14 of MMC treatment, using the CASY Cell Counter and Analyzer. AH13r cells were treated with 0.05% DMSO (control), 10 µg/ml BVDU, increasing doses of 35–75 ng/ml MMC only, and MMC+BVDU. B, apoptosis assay. HOPI staining image, example. Blue arrows, viable cells; yellow arrows, early apoptosis; white arrow, late apoptosis; red arrow, necrosis.
These results were confirmed by HOPI analysis (10) ; Fig. 2B). BVDU cotreatment increased the number of apoptotic cells on average by 15% (Fig. 1B, right). We next investigated several survival pathways using Western blot analysis. This included the Akt/forkhead-related transcription factor pathway, the Raf/extracellular signal-regulated kinase, MDM2, p14, p53, p38, and survivin pathways. Neither of those appeared to be affected by BVDU cotreatment. Also, the expression patterns of several cell cycle regulators such as p27, p16, cyclin-dependent kinases, and cyclins remained unchanged (data not shown).
However, BVDU in combination, but not by itself, reduced the amount of the oncogene protein STAT3 to up to 50% (Fig. 3A). Moreover, in combination with DOX or MMC, this reduction of STAT3 expression by BVDU was maximal during recovery, when the cytostatic drug was omitted after previous treatment, but BVDU was still present (see Fig. 1C). Additionally, during MMC recovery, the oncogene protein JUN-D was overexpressed, but remained at control level in the presence of BVDU. Treatment was also accompanied by activation of caspase-3 (Fig. 3A).
|
||||||||||||||


